

We are excited to tell you about some big updates to Develocity!
The new Develocity 2018.2 release has something for everyone – developers, build engineers, and Gradle administrators.
First, for build engineers, many issues are only evident by looking at aggregate data across thousands of builds. But this data is tedious to get and organize – if you can get it at all.
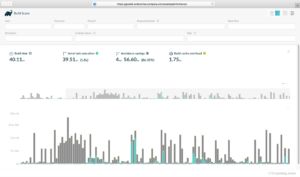
For this, we have built a Build Performance Dashboard that gives you a graphical view and metrics from aggregate build scan data from your entire team. The dashboard should really speed up your debugging!
You can also answer questions like:
- How much time did the cache save on project Z in the last 3 weeks?
- How much build time is wasted time and what does this cost us?
- Show me spikes and pathological builds
For a grand tour of the dashboard, see this recorded demo and product story:
For developers, we know it’s painful to sort through the console output of multiple parallel tasks. In build scans, you can now view log output for a single task or task type. In case your build failed due to a task failure (for example a compile failure) you can directly navigate from the failure to the task’s console log to see the details of what went wrong.
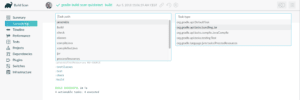
We think this feature will have an outsized impact on your day-to-day experience!
For Gradle administrators, you can now configure how long you keep build scans so that you can choose to save disk space. Most installs won’t require this, but it might be useful for larger ones.
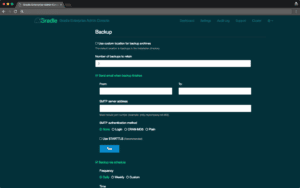
We also streamlined the backup process and give you more ways to configure this.
There is a lot more in Develocity 2018.2 – for all the new features see the release notes.
On behalf of our team, we appreciate the opportunity to work with you and look forward to your feedback!
– The Gradle Inc. Team